Using Spectra Diagnostics
The spectra diagnostics compute the distribution of variance across horizontal spatial scales for background fields, analysis increments, and experiment‑to‑experiment differences. For the mathematical formulation and example figures, see Diagnostics Overview.
Two CLI drivers are provided:
ufsda-spectra-ana-inc— compare analysis increments between CTRL and EXPufsda-spectra-bkg-inc— compare background vs increment spectra for a single experiment
Analysis Increment Spectra (CTRL vs EXP)
This diagnostic compares the spectral variance of analysis increments from two experiments (e.g., CTRL vs EXP).
ufsda-spectra-ana-inc --yaml /path/to/spectra_ana_inc.yaml
Background vs Increment Spectra
This diagnostic compares the background spectrum with the increment spectrum for a single experiment.
ufsda-spectra-bkg-inc --yaml /path/to/spectra_bkg_inc.yaml
Example Figure
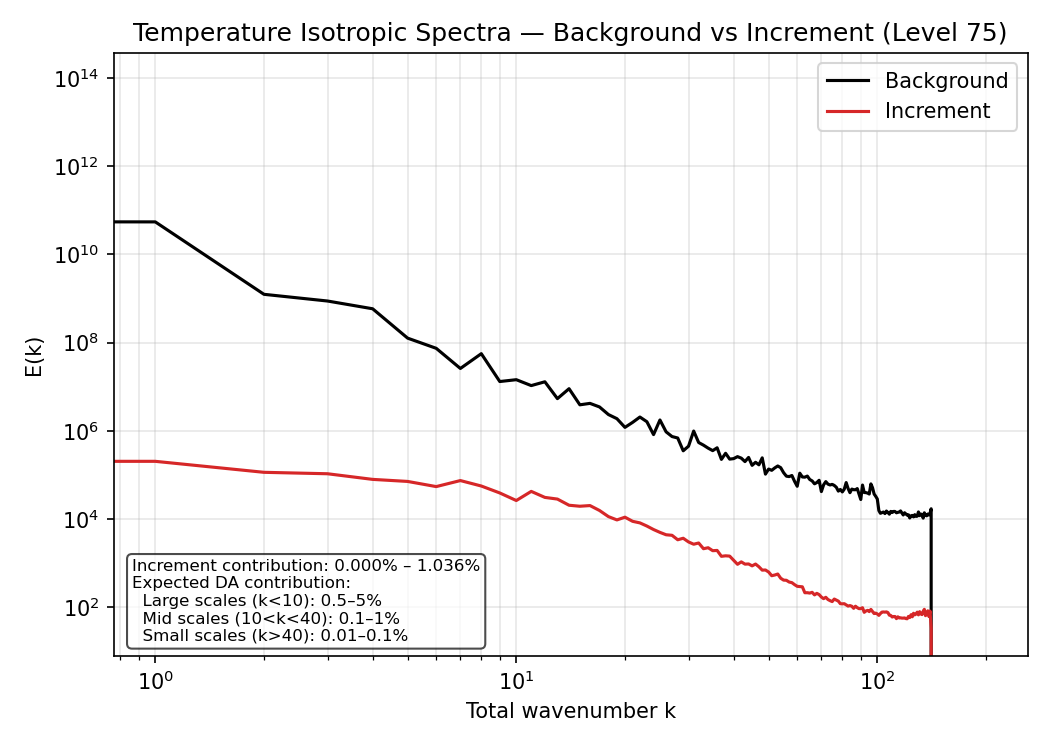
Background and increment spectra for temperature at model level 75. The increment spectrum shows how analysis updates redistribute variance across spatial scales relative to the background. Enhanced small‑scale variance indicates localized corrections, while reduced high‑wavenumber variance indicates smoother increments.
NICAS Length‑Scale Example
The NICAS experiment modifies the static background‑error covariance by increasing the horizontal correlation length scale in the SABER NICAS operator. A larger length scale produces broader spatial correlations and smoother increments, which appear in the spectra as enhanced low‑wavenumber variance and reduced high‑wavenumber variance.

Comparison of CTRL and NICAS length‑scale experiments for temperature increments at level 75. The NICAS experiment uses a larger horizontal correlation length scale, broadening the background‑error correlations and shifting variance toward large scales.
YAML Example
Below are two YAML configurations used for spectral diagnostics in the training workflow.
CTRL vs EXP Increment Spectra
vars:
  - T_inc
  - sphum_inc
  - u_inc
  - v_inc

levels:
  - 126
  - 75

zonal_mean:
  enabled: true
  full_vertical: true

experiments:
  - name: ctrl
    prefix: "/work2/noaa/epic/CADRE2026/cadre26.8434573.day1/output/ufsda.t00z.atminc.cubed_sphere_grid.tile"

  - name: atms-thining
    prefix: "/work2/noaa/epic/CADRE2026/cadre26.8487556.day2_nicas-length-scale/output/ufsda.t00z.atminc.cubed_sphere_grid.tile"

grid:
  prefix: "/work2/noaa/epic/CADRE2026/grid/C96_grid.tile"

spectra:
  levels:
    - 126
    - 75
  output_dir: "./day2_nicas_length_scale/spectra-inc"
Background vs Increment Spectra
vars:
  - T_inc
  - sphum_inc
  - u_inc
  - v_inc

levels:
  - 126
  - 75

zonal_mean:
  enabled: true
  full_vertical: true

background:
  atm_file: /work2/noaa/epic/CADRE2026/cadre26.8434573.day1/bkg/ufsda.t18z.atm.f006.cubed_sphere_grid.nc
  vars:
    - ugrd
    - vgrd
    - tmp
    - spfh

increments:
  prefix: /work2/noaa/epic/CADRE2026/cadre26.8434573.day1/output/ufsda.t00z.atminc.cubed_sphere_grid.tile
  grid_prefix: /work2/noaa/epic/CADRE2026/grid/C96_grid.tile
  vars:
    - u_inc
    - v_inc
    - T_inc
    - sphum_inc

mapping:
  - bkg: ugrd
    inc: u_inc
    long_name: "Zonal wind"

  - bkg: vgrd
    inc: v_inc
    long_name: "Meridional wind"

  - bkg: tmp
    inc: T_inc
    long_name: "Temperature"

  - bkg: spfh
    inc: sphum_inc
    long_name: "Specific humidity"

spectra:
  levels:
    - 126
    - 75
  output_dir: "./day1_ctrl/spectra-bkg-inc"
Outputs
The spectra diagnostics tool produces the following outputs inside the
directory specified by output_dir in the YAML file:
spectra_1d/— 1D isotropic spectra for each variable and levelspectra_2d/— 2D wavenumber–level color maps (kx vs level or isotropic wavenumber vs level), including CTRL, EXP, and ratio/differencevertical_variance/— vertical variance profiles and EXP/CTRL ratiosfigures/— PNG figures for all spectra diagnostics, including 1D spectra, 2D spectra, and vertical variance plots
These outputs provide scale‑dependent insight into how increments or experiment differences redistribute variance across horizontal scales and vertical levels.