Using Increment Diagnostics
The increment diagnostics subsystem generates FV3 6‑tile maps, stitched global maps, and zonal‑mean summaries for analysis increments. These diagnostics provide spatial insight into how the analysis modifies the background state. They are complementary to observation‑space and spectral diagnostics but do not compute spectra.
Running the CLI Tool
The main driver for increment diagnostics is:
ufsda-inc-maps --yaml /path/to/increment_maps.yaml
This tool loads FV3 tiles, constructs global stitched fields, and computes zonal‑mean cross sections for each variable and level specified in the YAML file.
Example Figures
Global Increment Map
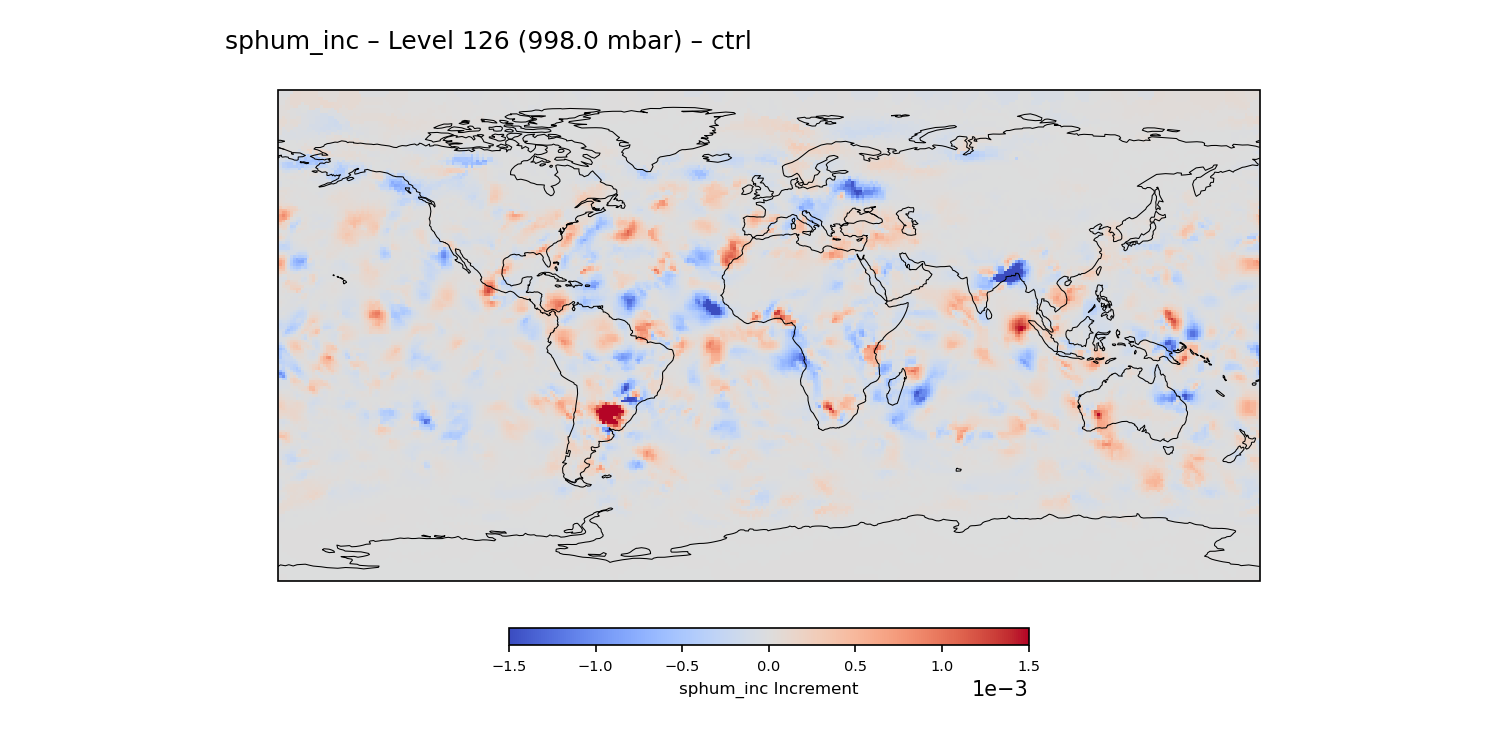
Example stitched global increment map for specific humidity at model level 126. Positive increments indicate moistening applied by the analysis, while negative increments indicate drying.
Zonal‑Mean Increment Cross‑Section
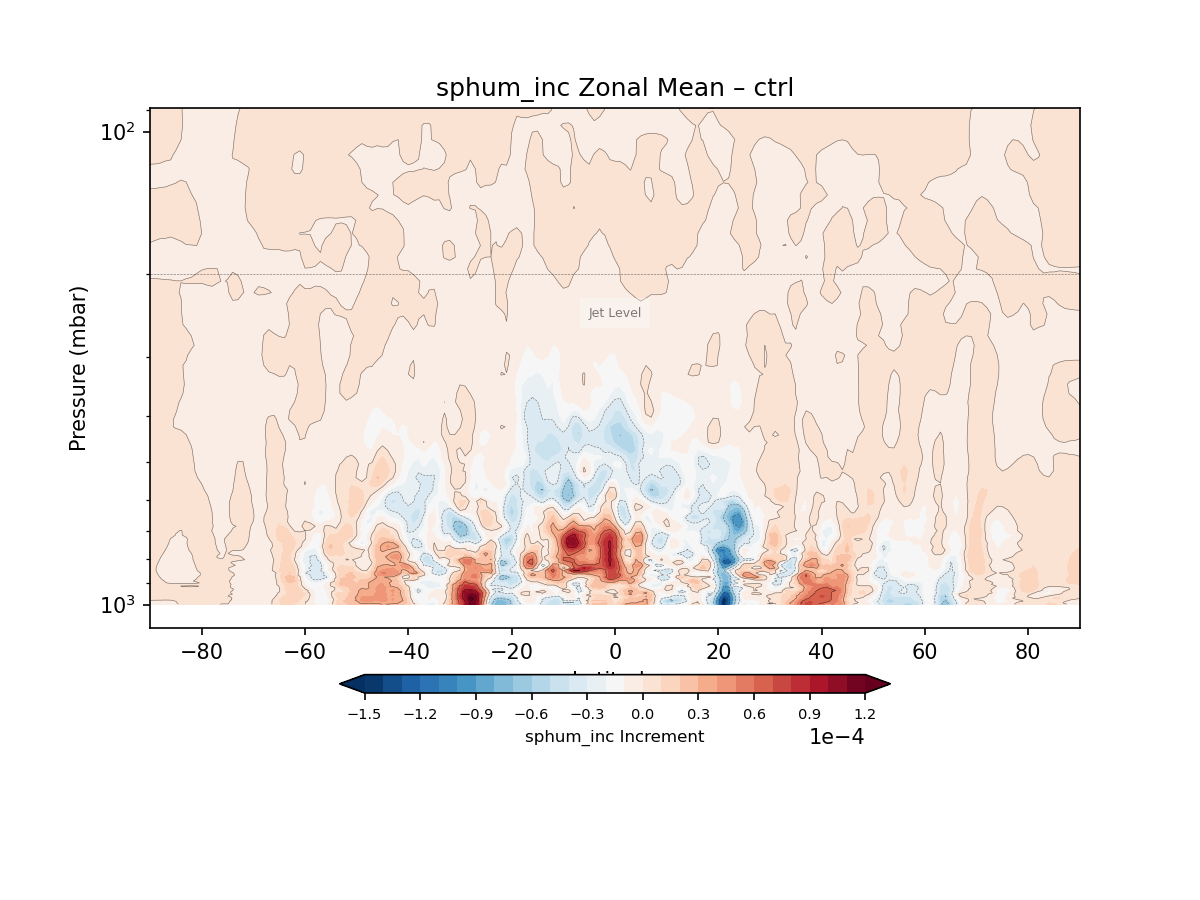
Full‑vertical zonal‑mean increment cross‑section for specific humidity. This view highlights the vertical structure and latitudinal distribution of the analysis increments.
YAML Configuration
A minimal YAML configuration for increment maps:
experiments:
  - name: EXP
    prefix: /path/to/exp/ufsda.t00z.atminc.cubed_sphere_grid.tile

grid:
  prefix: /path/to/grid/C96_grid.tile

output_dir: increment_maps/

vars:
  - u_inc
  - v_inc
  - T_inc
  - sphum_inc

levels:
  - 126
  - 75
Amplification Options
Increment fields are often small in magnitude, especially for humidity and wind components. To improve visual interpretability, the increment diagnostics support optional amplification of plotted fields.
Amplification is controlled through the amplify section of the YAML
configuration:
amplify:
  enabled: true
  factor: 2.0
  apply_to_diff: false
Options
enabledEnables or disables amplification. When
true, all CTRL and EXP fields are multiplied by the specified factor before plotting.factorScalar multiplier applied to increment values. Typical values range from 1.5 to 5.0 depending on variable magnitude.
apply_to_diffControls whether the DIFF field (
EXP − CTRL) is also amplified. By default this isfalseto preserve the true magnitude of experiment differences. When set totrue, the DIFF field is amplified using the same factor.
Behavior Summary
CTRL fields → amplified when
enabled: trueEXP fields → amplified when
enabled: trueDIFF fields → amplified only when
apply_to_diff: trueZonal‑mean plots follow the same rules
Example
To amplify all fields including DIFF by a factor of 2:
amplify:
  enabled: true
  factor: 2.0
  apply_to_diff: true
Outputs
global_maps/— stitched global maps for each variable and levelzonal_means/— zonal‑mean cross sections (latitude vs level)
These outputs provide complementary spatial perspectives on the structure and scale of analysis increments.